Here is a video from AdobeTV of Greg Rewis' run through of some of the new features and improvements in Flash Professional CS5. These include text layout framework, code snippets, ActionScript editor, Spring for bones, video improvements, new deco brushes, and Flash Builder & mobile content.
http://images.tv.adobe.com/swf/player.swf
Monday, April 19, 2010

Saturday, April 10, 2010
e-Learning via the BBC

I was adding another course on the free e-learning page and what really jumped out at me is there are an awful lot of examples from the BBC. They have been producing a lot of great stuff, so I thought I would share all the BBC examples I have found. I am sure there are even more to be found on the BBC site.
e-Learning I have found at the BBC
Archaeology Games - BBC
Caveman Challenge - BBC
Computer Tutor - BBC
WebWise - BBC
Ancient History - BBC
British History - BBC
British History Timeline - BBC
Climate Challenge - BBC
Interactive Body - BBC
The Tsunami Disaster Explained - BBC (2004)
Ancient Greeks: The Olympic Games - BBC
Guide to the Basics of American Football - BBC
Viewing these and other quality courses and interactives is a great way to get inspiration and ideas for creating your own engaging courses. There are plenty more examples of e-learning on the Free e-Learning page.
Monday, April 5, 2010
Something You Won't See on The iPad
http://images.tv.adobe.com/swf/player.swf
The devices shown have Adobe Flash, but the iPad does not. So much e-learning is made in Flash, or published as SWF files, and iPad users will not have access to it. What a shame.
The devices shown have Adobe Flash, but the iPad does not. So much e-learning is made in Flash, or published as SWF files, and iPad users will not have access to it. What a shame.
Friday, April 2, 2010
Keeping Up - April's Big Question
 April's Big Question from Learning Circuits is "How to Keep up?" This is in reference the immense and rapidly expanding technology tools.
It is tough to stay on top of all the emerging tools. However, being involved in an e-learning community is a big help. For me it is a blog community and following many experts on Twitter. Not only am I often made aware of new tools, but also get opinions, tips, and examples of their use. You can never keep up with it all, but access to many experts who are also finding and sharing the lastest tech tools make it much less daunting.
Many of the blogs I follow are part of the eLearningLearning community. So, I browsed "Tools" by keyword on eLearningLearning. Here are the results and the level of exposure to technology tools this community provides:
That is a lot of tools this blogging community has discussed and introduced to its readers. I also like to make occasional visits to Google Labs and Adobe Labs to "keep up" with the tech tools they are working on and to test drive any beta versions available. When I do find interesting tools I will keep track of them using my Delicious account. Tagged either under Development Toolsor Cloud. When it comes to free cloud apps, I also share them on my blog's Free Cloud Apps page.
It is tough to stay on top of all the great stuff being offered out there, but the blogs and social media certainly help.
Sunday, March 28, 2010
How Many Americans (U.S.) Have Broadband Access?
Over the years in corporate training departments I have been a bit spoiled when it comes to having an audience with a high speed connection. With very few exceptions, staff taking my e-learning courses have accessed them via company computers with high speed connections.
Recently, I have begun making Captivate demonstrations for external customers. For these demos I do not have the security of knowing they will be accessed with a high speed connection. So, when I plop them online with a note that they are best viewed with a high speed connection I have to ask myself, "how many people do have a high speed connections?"
The U.S. Department of Commerce released a research preview last month Digital Nation: 21st Century America's Progress Toward Universal Broadband Internet Access. Here are some of the charts included in the report, which provide insight into broadband access in the United States including demographic information. As you will also see, the "digital divide" is also reflected in the data.

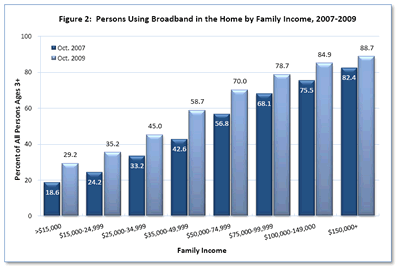


Source: Digital Nation: 21st Century America's Progress Toward Universal Broadband Internet Access, February 2010.
The report also delves into statistics on households with no Internet access at all. The U.S. Department of Commerce will have a more detailed analysis and report later this year. They will be using data from the 2010 census for the full report.
"In a globalized 21st century economy, when you don’t have regular access to high-speed Internet, you don’t have access to all the educational, business and employment opportunities it provides." - U.S. Commerce Secretary Gary Locke.
Recently, I have begun making Captivate demonstrations for external customers. For these demos I do not have the security of knowing they will be accessed with a high speed connection. So, when I plop them online with a note that they are best viewed with a high speed connection I have to ask myself, "how many people do have a high speed connections?"
The U.S. Department of Commerce released a research preview last month Digital Nation: 21st Century America's Progress Toward Universal Broadband Internet Access. Here are some of the charts included in the report, which provide insight into broadband access in the United States including demographic information. As you will also see, the "digital divide" is also reflected in the data.
Source: Digital Nation: 21st Century America's Progress Toward Universal Broadband Internet Access, February 2010.
The report also delves into statistics on households with no Internet access at all. The U.S. Department of Commerce will have a more detailed analysis and report later this year. They will be using data from the 2010 census for the full report.
"In a globalized 21st century economy, when you don’t have regular access to high-speed Internet, you don’t have access to all the educational, business and employment opportunities it provides." - U.S. Commerce Secretary Gary Locke.
Sunday, March 21, 2010
Baltimore's Bid for Google Fiber
 Baltimore has put in a bid for Google Fiber, which is Google's experiment to select one or more trial locations for a ultra high speed fiber network.
Here is brief description from Google of what they are planning to build:
Google is planning to build and test ultra-high speed broadband networks in one or more trial locations across the country. We'll deliver Internet speeds more than 100 times faster than what most Americans have access to today over 1 gigabit per second, fiber-to-the-home connections. We'll offer service at a competitive price to at least 50,000 and potentially up to 500,000 people.
Of course I am biased as a resident of the Baltimore area, but I truly believe Baltimore is a fantastic location for this special opportunity. It is the location of superb higher educational institutions, research facilities, science and technology industry, and highly creative and innovative residents. Baltimore has a website that supports Baltimore's bid and it includes community support via videos and Google Maps.
You can also provide support for Baltimore's bid, if interested. The deadline for submitting your support for Baltimore or any of the other towns' bids is March 26, 2010.
Saturday, March 13, 2010
Public Data Explorer - Google Labs
Google Labs recently released their Public Data Explorer. You can create charts and visualizations with public data sets. I created the examples below from data provided by the World Bank. The amount of data provided by the World Bank is impressive.
[googleapps domain="www" dir="publicdata/explore/embed" query="ds=d5bncppjof8f9_&ctype=l&met_y=it_net_user_p2&scale_y=lin&ind_y=false&rdim=country&idim=country:USA:GBR:JPN:IND:KOR:BRA&tdim=true&tstart=631152000000&tunit=Y&tlen=18&hl=en_US&dl=en_US" width="400" height="325" /]
[googleapps domain="www" dir="publicdata/explore/embed" query="ds=d5bncppjof8f9_&ctype=c&met_y=it_net_user_p2&scale_y=lin&ind_y=false&idim=country:HUN:GAB:NLD:TUR&ifdim=country&pit=1199145600000&hl=en_US&dl=en_US" width="400" height="325" /]
[googleapps domain="www" dir="publicdata/explore/embed" query="ds=d5bncppjof8f9_&ctype=b&met_s=it_net_user_p2&scale_s=lin&ind_s=false&met_y=it_net_user_p2&scale_y=lin&ind_y=false&met_x=it_net_user_p2&scale_x=lin&ind_x=false&idim=country:USA:KOR&ifdim=country&pit=1199145600000&hl=en_US&dl=en_US" width="400" height="325" /]
[googleapps domain="www" dir="publicdata/explore/embed" query="ds=d5bncppjof8f9_&ctype=m&met_s=it_net_user_p2&scale_s=lin&ind_s=false&idim=country:USA:GBR&ifdim=country&pit=1199145600000&hl=en_US&dl=en_US&mapType=t" width="400" height="325" /]
In my opinion, the animated map and bubble views need some work, but it is a beta so I will cut Google some slack.
In addition to data from the World Bank, they have data from the California Department of Education, U.S. Census Bureau, Eurostat and more. Researchers and teachers alike may find Public Data Explorer very useful. So, give it a test drive. FYI: You can embed your charts into a webpage or blog (like the examples above), which are updated automatically so the data is current. I will also be adding this new tool to the Cloud Apps page .
[googleapps domain="www" dir="publicdata/explore/embed" query="ds=d5bncppjof8f9_&ctype=l&met_y=it_net_user_p2&scale_y=lin&ind_y=false&rdim=country&idim=country:USA:GBR:JPN:IND:KOR:BRA&tdim=true&tstart=631152000000&tunit=Y&tlen=18&hl=en_US&dl=en_US" width="400" height="325" /]
[googleapps domain="www" dir="publicdata/explore/embed" query="ds=d5bncppjof8f9_&ctype=c&met_y=it_net_user_p2&scale_y=lin&ind_y=false&idim=country:HUN:GAB:NLD:TUR&ifdim=country&pit=1199145600000&hl=en_US&dl=en_US" width="400" height="325" /]
[googleapps domain="www" dir="publicdata/explore/embed" query="ds=d5bncppjof8f9_&ctype=b&met_s=it_net_user_p2&scale_s=lin&ind_s=false&met_y=it_net_user_p2&scale_y=lin&ind_y=false&met_x=it_net_user_p2&scale_x=lin&ind_x=false&idim=country:USA:KOR&ifdim=country&pit=1199145600000&hl=en_US&dl=en_US" width="400" height="325" /]
[googleapps domain="www" dir="publicdata/explore/embed" query="ds=d5bncppjof8f9_&ctype=m&met_s=it_net_user_p2&scale_s=lin&ind_s=false&idim=country:USA:GBR&ifdim=country&pit=1199145600000&hl=en_US&dl=en_US&mapType=t" width="400" height="325" /]
In my opinion, the animated map and bubble views need some work, but it is a beta so I will cut Google some slack.
In addition to data from the World Bank, they have data from the California Department of Education, U.S. Census Bureau, Eurostat and more. Researchers and teachers alike may find Public Data Explorer very useful. So, give it a test drive. FYI: You can embed your charts into a webpage or blog (like the examples above), which are updated automatically so the data is current. I will also be adding this new tool to the Cloud Apps page .
Subscribe to:
Posts (Atom)