I was having a discussion with some fellow eLearning designers and we got deep into the complexities of working with subject matter experts (SME). Many great ideas came out of the discussion (e.g., guidelines, agreements, best methods of identifying SMEs and a lead SME, etc.). One thing I brought up was that so few SMEs realize what is involved in the process of creating elearning courses or any instruction for that matter. I mentioned that I have been wanting to create an infographic demonstrating the process of developing elearning, from inception to loading it to the LMS. It would be helpful to SMEs and the elearning designer trying to bring them into the fold... and down to reality.
Well, one of my fellow elearning designers said, "Have you looked? There's probably already one out there." So, I looked and found the following infographic.
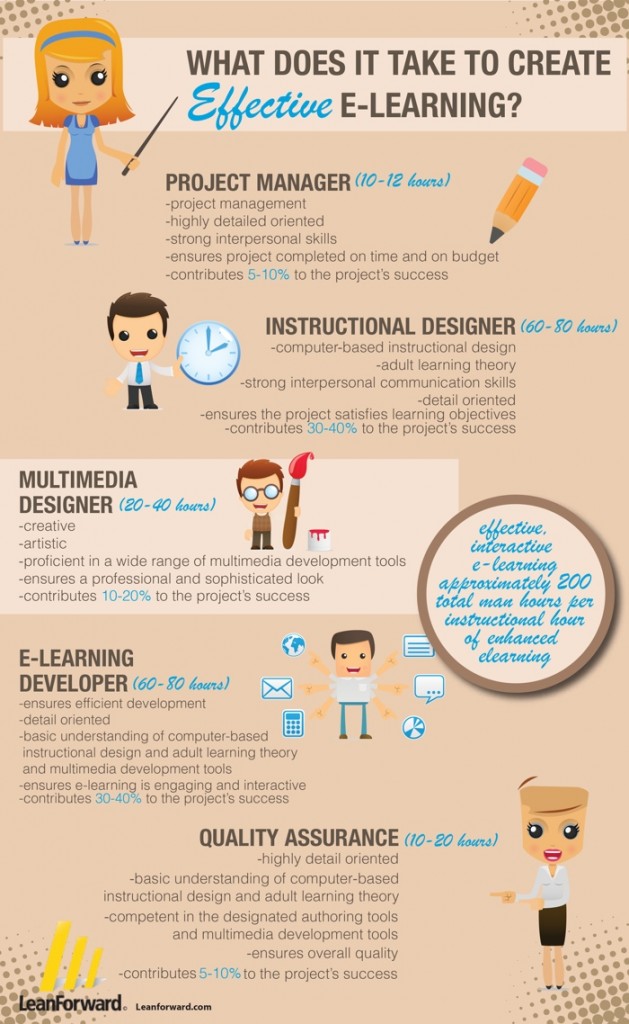
It is a good overview of the process of creating effective eLearning... and I'm glad they (Leanforward) added the word "effective." After all, much less is involved in developing "ineffective" learning. The times listed do have to be taken with a grain of salt. Although I think they are not too far off in many scenarios, there are many variables that affect the time involved (e.g., complexity of content, multimedia used, level of interactivity, developers skill level with development tools, etc.). The competencies and time needed for implementation, (e.g., loading to the LMS or web, testing, enrolling staff, etc.) is not addressed. Something to also consider mentioning when sharing this with your SMEs.
I think it will be a good thing to also share with anyone interested in entering the elearning field - So, they know what they are getting themselves into and the competencies they will need.
In addition to this infographic, Graphs.net has quite a few more eLearning infographics of interest.